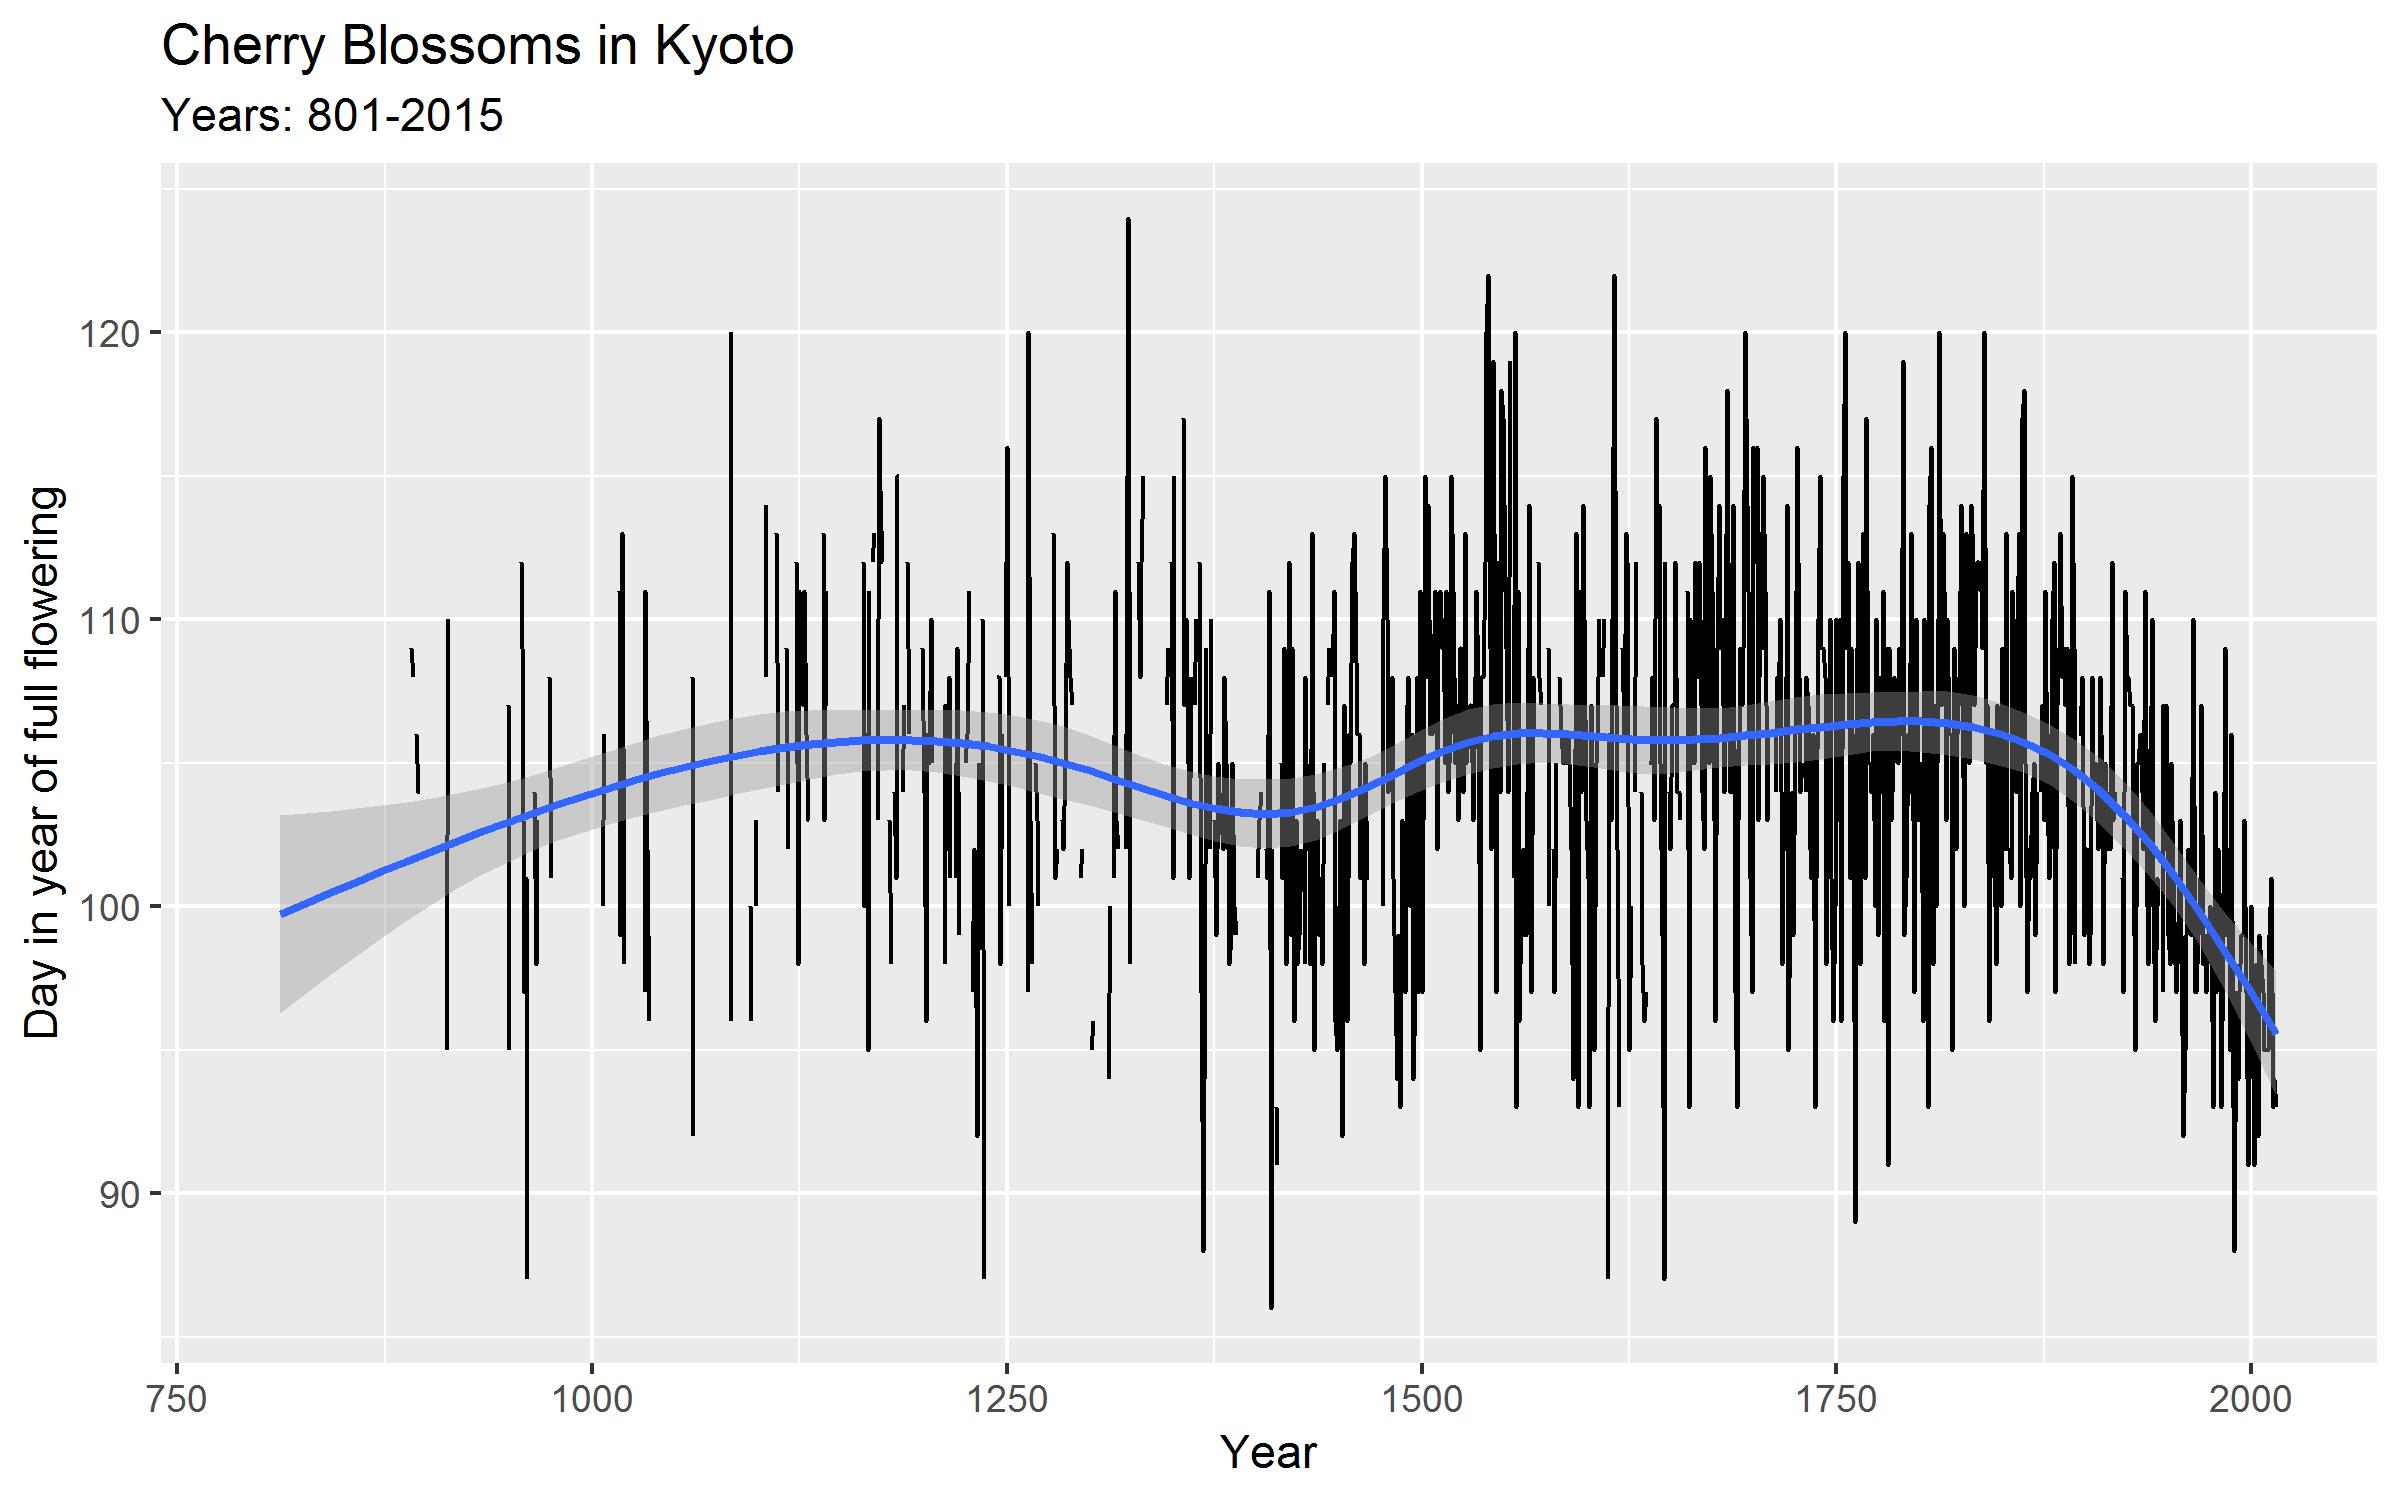
Cherry blossoms in Kyoto, 801-2015
Cosma Shalizi offers a course with great name “Data over Space and Time”. As part of this course he uses data on the first day in the year that the cherry trees in Kyoto started blossoming. This data was collected by Yasuyuki Aono and coauthors.
Let’s check it out:
library(tidyverse)

kyoto <- read_csv("http://www.stat.cmu.edu/~cshalizi/dst/18/data/kyoto.csv")

ggplot(kyoto, aes(Year.AD, Flowering.DOY)) +
  geom_line() +
  labs(title = "Cherry Blossoms in Kyoto",
       subtitle = "801-2015",
       x = "Year",
       y = "Day in year of full flowering") +
  geom_smooth()
Note the earlier blossoming of trees at the end of the sample which is a sign of rising temperatures.